| Figure 2-15 | FIRST | PREV | NEXT | LAST | INDEX | CHAPTER INDEX |
| Reservoir Characterization - Chapter 2 | ||
|
||
|
|
||
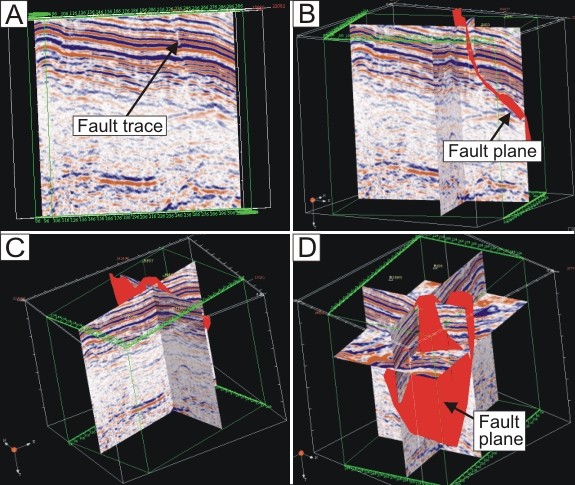
| (A) A single seismic profile from a 3D seismic survey. A fault trace is shown. (B) Crossing profiles from the survey with the fault plane are highlighted. (C) Another view of the crossing profiles and the fault plane (red). (D) A horizontal plane or seiscrop section has been added, and the fault plane (red) mapped into the 3D volume. |