Elsevier · Medard, Sprintson: Network Coding, 1st Editionst Edition · Welcome

Welcome

Tropical Radioecology
Buy this book

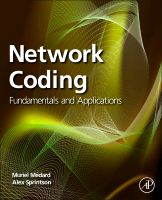
Welcome to the website for Medard, Sprintson: Network Coding: Fundamentals and Applications, 1st Editionst Edition.


Network Coding

About this Companion Site

This Site consists of Color figures.

Colour figures

Chapter 03
  • Figure 3.1 An illustration of the trellis graph G*.
  • Chapter 04
  • Figure 4.1 Video broadcasting from one device to multiple receivers.
  • Figure 4.2 Content distribution in a Multi-Hop Network.
  • Figure 4.3 Viral content spreading.
  • Figure 4.4 Mobile distributed storage.
  • Figure 4.5 Multi-path reception.
  • Figure 4.7 NC system with erasures.
  • Figure 4.8 Dilbert on randomness. © United Feature Syndicate INC./Dist. by PIB Copenhagen 2010.
  • Figure 4.9 Coding throughput on a Nokia N95 mobile phone, with look-up table based implementation. Generation sizes between 10 and 400 and the block size of 1.5 kB [17] are tested.
  • Figure 4.10 Decoding throughput on a powerful desktop PC fitted with a Nvidia 260 GTX graphics card. Generation sizes of 128, 256, 512 are tested along with block sizes between 1 kB and 32 kB.
  • Figure 4.11 Decoding throughput on an OpenGL graphics card. Generation sizes between 16 and 64 are tested at a block size of 1 kB.
  • Figure 4.12 Decoding throughput on a Nokia N95-8GB. Generation sizes between 16 and 64 are tested at a block size of 1.5 kB.
  • Figure 4.13 Pure NC: (a) Partially decoded data; (b) Image starting to appear as the decoders rank increases; (c) The final decoded image. Systematic NC: (d) Received uncoded data; (e) Erasures corrected by coded packets; (f) The final decoded image.
  • Figure 4.14 Application throughput with and without NC.
  • Figure 4.15 Normalized energy consumption of the application with and without NC.
  • Figure 4.16 Trade-off between low and high field size and generation size.
  • Chapter 05
  • Figure 5.1 The network architecture of eMBMS.
  • Figure 5.2 The structure of the source block.
  • Figure 5.3 The framework of streaming and download services in eMBMS.
  • Figure 5.4 Cumulative Distribution Function of the actual packet error rate in each block with a different source block length.
  • Figure 5.5 Network architecture of user cooperation.
  • Figure 5.6 Illustration of progressive recovery in user cooperation.
  • Figure 5.7 Overhead saving in the cellular link by user cooperation.
  • Figure 5.8 Cooperation cost saving by network coding over the short-range link.
  • Figure 5.9 Comparison of the number of the exchanged packets over the short-range link with/without network coding
  • Chapter 06
  • Figure 6.1 The CONCERTO architecture. Double black lines indicate the processing flow for application packets generated at this node; blue lines indicate the processing flow for network coded packets received from neighbors (for forwarding and/or decoding); red lines indicate repair request packets received from neighbors; dashed green lines indicated intra-module control flow; and dashed orange lines indicate periodic and neighbor discovery packets. The yellow modules are network coding specific and are discussed in more detail in the remainder of this chapter.
  • Figure 6.2 A fixed size vector in each network coded packet contains the linear coefficients associated with the source packets. These coefficients are used by the destination to decode a generation of packets.
  • Figure 6.3 Subgraph constructor system diagram.
  • Figure 6.4 A six-node network that shows the flow of data and reliability control information.
  • Figure 6.5 The Master/Slave forwarding architecture.
  • Figure 6.6 Algorithm used by the Master Forwarder to select the next packet to send.
  • Figure 6.7 The network coding problem formulation treats unicast and broadcast as special cases of multicast. Here the light blue nodes are part of the subgraph that forwards information from the source S to the destinations D1 and D2.
  • Figure 6.8 Network coding is robust to routing "loops" since packets that are not innovative (do not contain new information) do not trigger a transmission.
  • Figure 6.9 Network coding provides low-latency link layer encoding as part of its normal operation.
  • Figure 6.10 Network coding naturally incorporates opportunistic receptions since innovative packets are always stored upon reception.
  • Figure 6.11 Network coding subgraph construction takes into account link quality and uses multiple low quality links if that is optimal.
  • Figure 6.12 Architecture of the baseline system.
  • Figure 6.13 Alpha/Bravo Phase includes 10 man-pack radios, two truck mounted radios and two aircraft mounted radios (not shown) as well as 21 stationary radios.
  • Figure 6.14 MANET topology during the Bravo/Charlie phase in the ground scenario. Note the large number of poor quality links.
  • Figure 6.15 Video flows used to evaluate baseline and CONCERTO performance in ground and air scenarios. Video Load 1 is "intra-squad" (within the green, blue, and orange circles) while Video Loads 2 (orange dashed lines) and 3 (Purple lines) add "inter-squad" multi-hop sessions.
  • Figure 6.16 Video performance comparison CONCERTO vs. Baseline in the Ground scenario.
  • Figure 6.17 CONCERTO and baseline latency for the air scenario.
  • Figure 6.18 Comparison of total network transmission.
  • Figure 6.19 Performance over distance.
  • Figure 6.20 Distance-utility comparison.
  • Figure 6.21 Subgraph consists of source node (green circles), forwarder nodes (blue circles), forwarder-destination nodes (yellow circles) and destination nodes (orange circles). Size of node (circle) indicates its forwarding rate.
  • Figure 6.22 Video performance in air scenario.
  • Chapter 09
  • Figure 9.1 Rateless broadcast over N independent erasure channels, where Cn[t] is Bernoulli distributed with mean cn.
  • Figure 9.2 Extension of the setup of Fig. 9.1 to a full tree of depth h, where each erasure link fades independently with the uniform mean of c.
  • Figure 9.4 Extension of the setup to streaming flows, where HOL stands for Head-of-Line.
  • Figure 9.5 Extension of the setup to streaming flows with delay sensitivities.
  • Figure 9.6 Optimum revenue performance of RNC for varying N and K.
  • Figure 9.7 Optimum revenue performance comparison of RNC versus Scheduling for varying K with N = 50.
  • Figure 9.8 Fraction of receivers that have successfully decoded a single packet in a block of K packets in s time slots,r'[S] as a function of s for c = 1/2.
  • Figure 9.9 Mean throughput behavior under different scalings of K with N.
  • Figure 9.10 Comparing actual throughput to upper and lower bounds for c = 0.9 and K = 50 ln(N).
  • Figure 9.11 Comparing actual throughput to upper and lower bounds for c = 0.9 and K = N.
  • Figure 9.12 The three phases of a typical delivery under the two-hop transmission scheme, in which the dotted line indicates the movement of the relay node over one or multiple time slots.
  • Figure 9.14 Delay-throughput trade-offs with coding and without coding.
  • Chapter 10
  • Figure 10.5 DTN with N = 101 nodes, homogeneous exponential inter-meeting time with rate β = 0.0049, bandwidth constraint of b = 1 packet per contact, and unlimited buffer space.
  • Figure 10.7 Block delivery delay vs transmission number trade-off under the same network setting as Fig. 10.5 except for the bandwidth and buffer constraints.
  • Figure 10.8 Impact of bandwidth and buffer constraints under the same network setting as Fig. 10.5 except the bandwidth and buffer constraint for (a) and (b) respectively.
  • Figure 10.9 Block delivery delay vs transmission number trade-off with full signaling and normal signaling, the network setting is the same as that of Fig. 10.5.
  • Figure 10.10 Block delivery delay under different number of nodes (Fig. 10.3 in [31]).
  • Disclaimer

    Information provided in this document is provided "as is" without warranty of any kind, either express or implied. Every effort has been made to ensure accuracy and conformance to standards accepted at the time of publication. The reader is advised to research other sources of information on these topics.

    The user assumes the entire risk as to the accuracy and the use of this document. This document may be copied and distributed subject to the following conditions:

    All text must be copied without modification and all pages must be included;
    All copies must contain the appropriate copyright notice and any other notices provided therein; and
    This document may not be distributed for profit.