Chapter 03
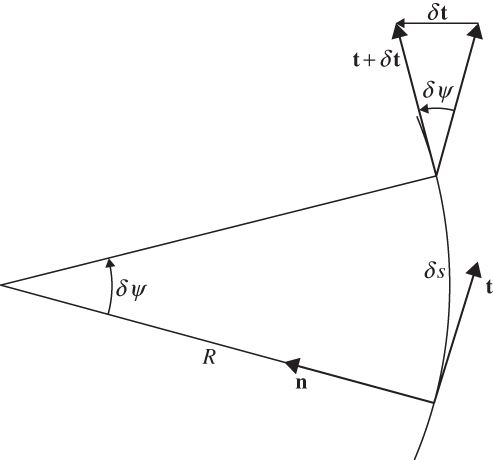
FIGURE 3.1 Rate of change of the unit tangent vector t following the motion.
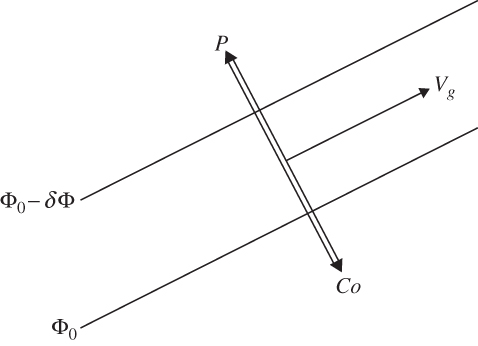
FIGURE 3.2 Balance of forces for geostrophic equilibrium. The pressure gradient force is designated by P and the Coriolis force by Co.
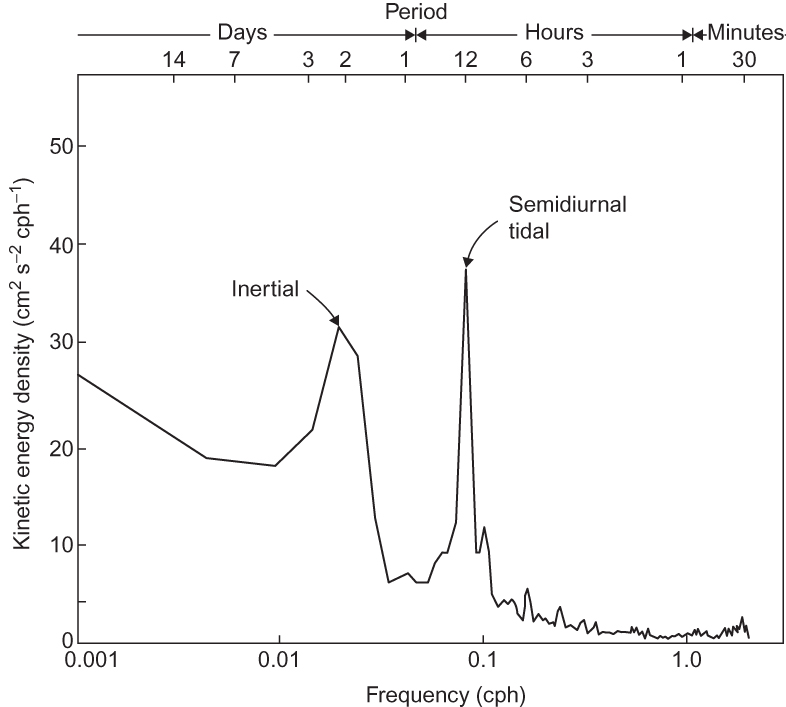
FIGURE 3.3 Power spectrum of kinetic energy at 30-m depth in the ocean near Barbados (13°N). Ordinate shows kinetic energy density per unit frequency interval (cph-¹ designates cycles per hour). This type of plot indicates the manner in which the total kinetic energy is partitioned among oscillations of different periods. Note the strong peak at 53 h, which is the period of an inertial oscillation at 13° latitude. (After Warsh et al., 1971. Copyright © American Meteorological Society. Reprinted with permission.)
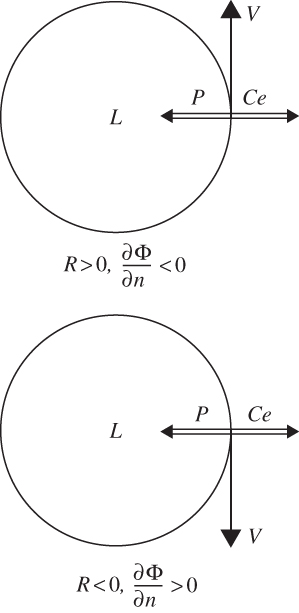
FIGURE 3.4 Force balance in cyclostrophic flow: P designates the pressure gradient; Ce designates the centrifugal force.
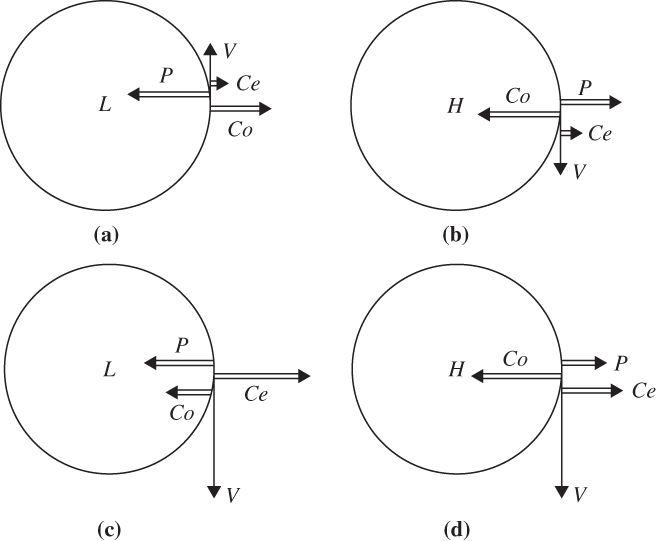
FIGURE 3.5 Force balances in the Northern Hemisphere for the four types of gradient flow: (a) regular low, (b) regular high, (c) anomalous low, and (d) anomalous high.
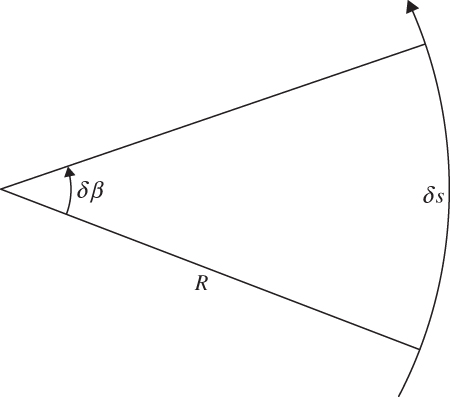
FIGURE 3.6 Relationship between the change in angular direction of the wind δβ and the radius of curvature R.
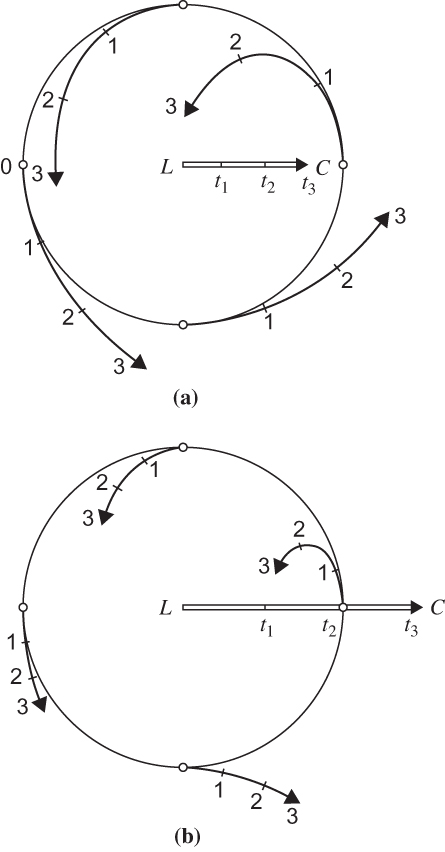
FIGURE 3.7 Trajectories for moving circular cyclonic circulation systems in the Northern Hemisphere with (a) V = 2C and (b) 2V = C. Numbers indicate positions at successive times. L designates a pressure minimum.
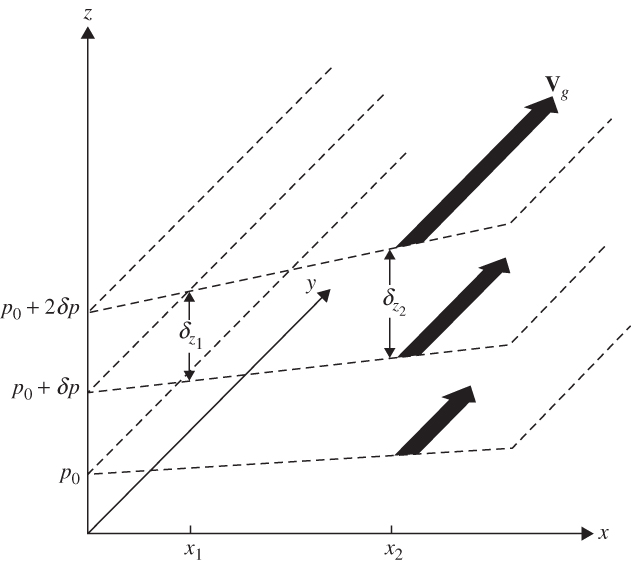
FIGURE 3.8 Relationship between vertical shear of the geostrophic wind and horizontal thickness gradients. (Note that δp < 0.).
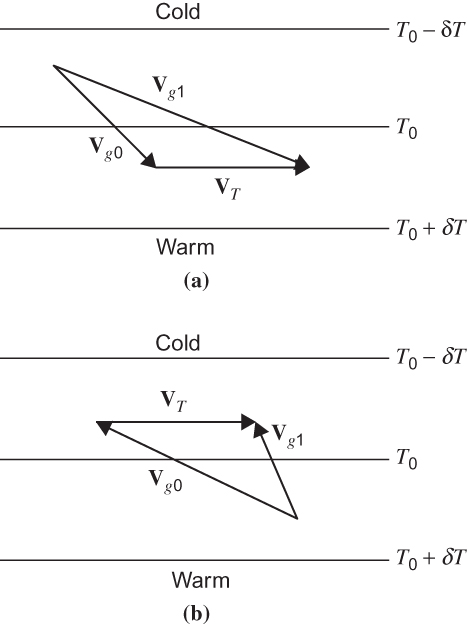
FIGURE 3.9 Relationship between turning of geostrophic wind and temperature advection: (a) backing of the wind with height and (b) veering of the wind with height.
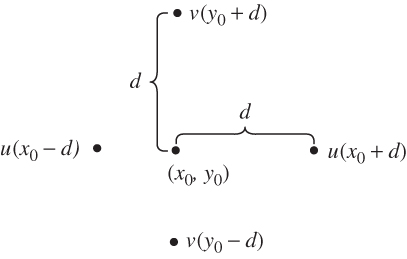
FIGURE 3.10 Grid for estimation of the horizontal divergence.
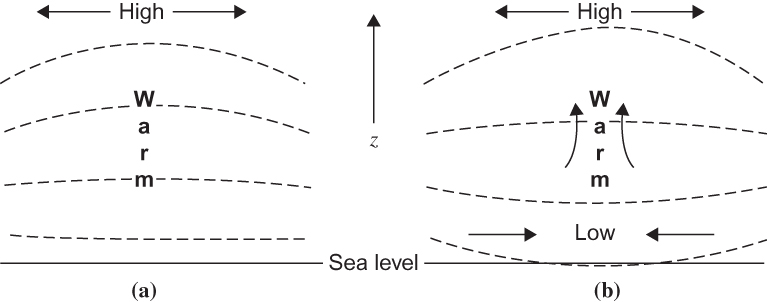
FIGURE 3.11 Adjustment of surface pressure to a midtropospheric heat source. Dashed lines indicate isobars. (a) Initial height increase at upper-level pressure surface. (b) Surface response to upper-level divergence.