Chapter 04
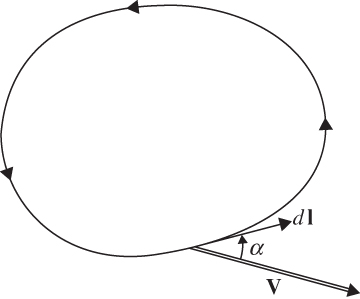
FIGURE 4.1 Circulation about a closed contour.
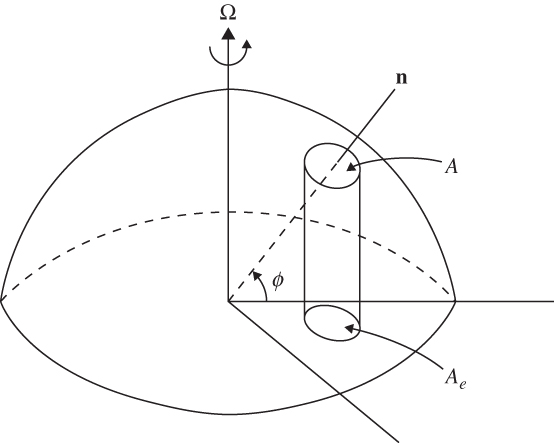
FIGURE 4.2 Area Ae subtended on the equatorial plane by horizontal area A centered at latitude Φ.
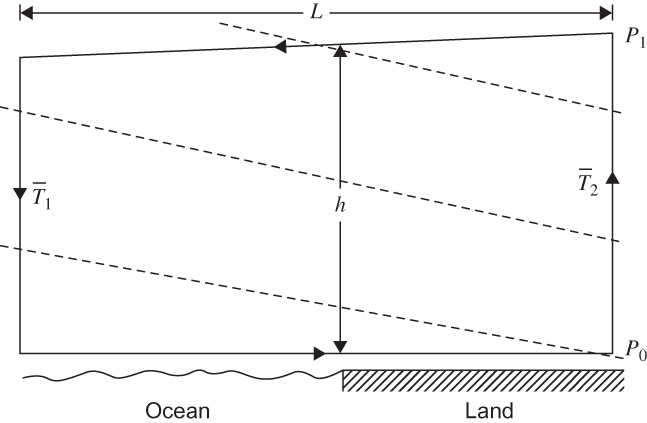
FIGURE 4.3 Application of the circulation theorem to the sea breeze problem. The closed heavy solid line is the loop about which the circulation is to be evaluated. Dashed lines indicate surfaces of constant density.
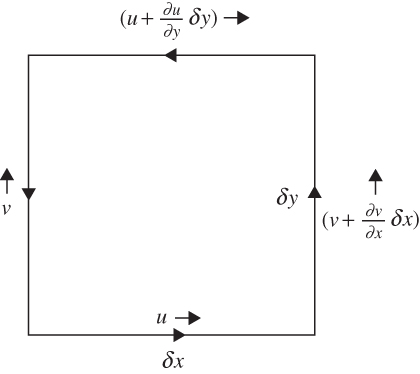
FIGURE 4.4 Relationship between circulation and vorticity for an area element in the horizontal plane.
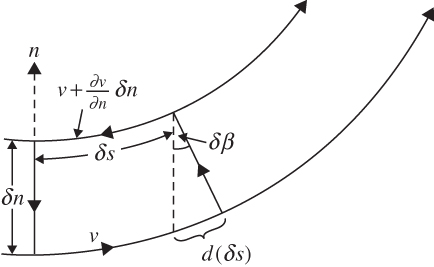
FIGURE 4.5 Circulation for an infinitesimal loop in the natural coordinate system.
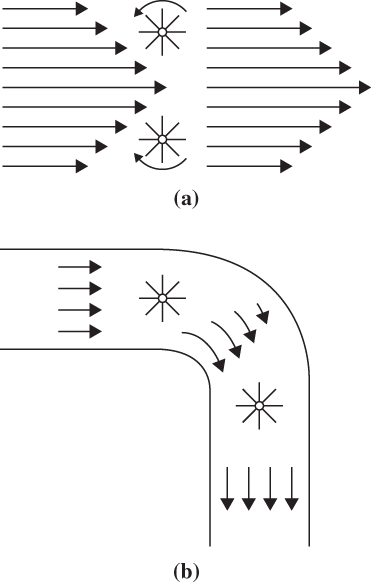
FIGURE 4.6 Two types of two-dimensional flow: (a) linear shear flow with vorticity and (b) curved flow with zero vorticity.
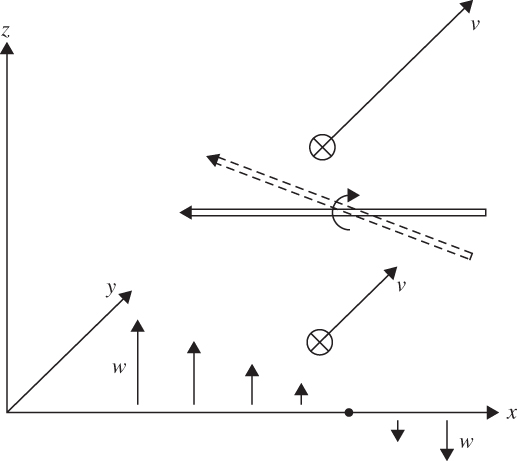
FIGURE 4.7 Vorticity generation by the tilting of a horizontal vorticity vector (double arrow).
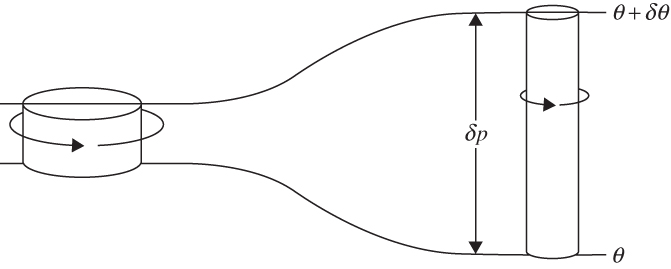
FIGURE 4.8 A cylindrical column of air moving adiabatically, conserving potential vorticity.
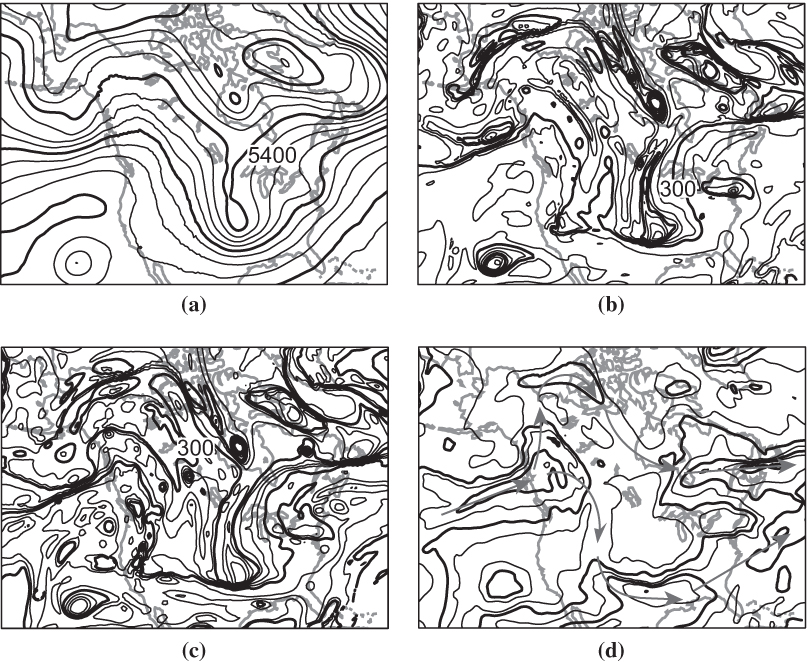
FIGURE 4.9 Comparison of 500-hPa geopotential height (a) and tropopause maps of pressure (b) potential temperature (c) and wind speed (d) on January 12, 2012. Geopotential height is shown every 60 m, potential temperature every 5 K, pressure every 50 hPa, and wind speed every 10 m s-¹. Every fourth contour is shown bold except every second contour for wind speed. Gray arrows in (d) illustrate the path of the main branches of jet streams.
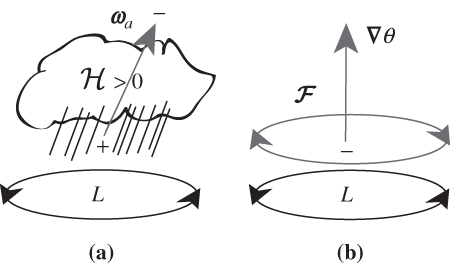
FIGURE 4.10 Cartoon illustrating the role of sources of (a) entropy and (b) momentum on changing the potential vorticity. (a) Depicts a precipitating cloud above a surface cyclone, where the vorticity vector,ω, points upward and to the right. Latent heating reaches a maximum in the cloud, which produces a positive (negative) PV tendency below (above) the cloud. (b) Depicts the role of surface friction (gray arrow opposite surface circulation). The curl of surface friction points in the opposite direction of the vorticity vector, producing a negative PV tendency.
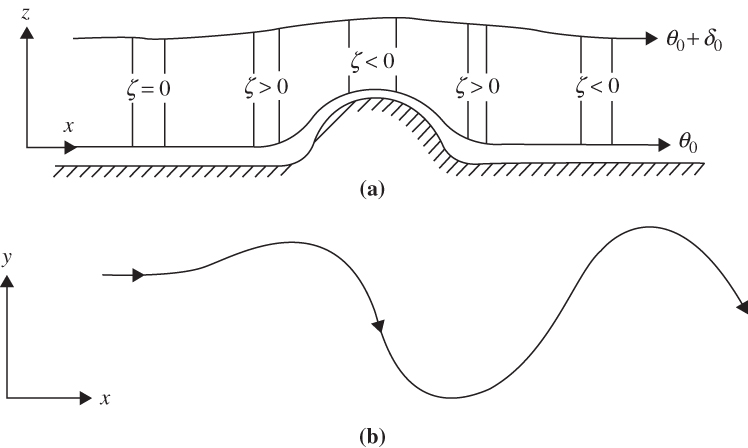
FIGURE 4.11 Schematic view of westerly flow over a topographic barrier: (a) the depth of a fluid column as a function of x and (b) the trajectory of a parcel in the (x, y) plane.
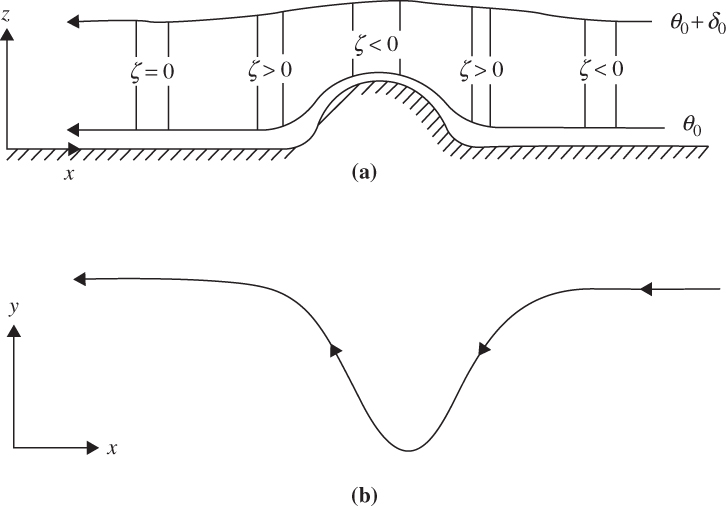
FIGURE 4.12 As in Figure 4.11, but for easterly flow.
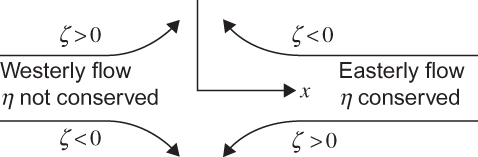
FIGURE 4.13 Absolute vorticity conservation for curved flow trajectories.