
Chapter 1.4: Describing and Visualizing Data
You need to know some basic information about your data before you can delve into any analysis. This information will help you decide if the data are appropriate for your study, what type of analyses you can conduct, and what initial patterns you should look for. Describing and visualizing the data are important first steps in ANY statistical analysis.
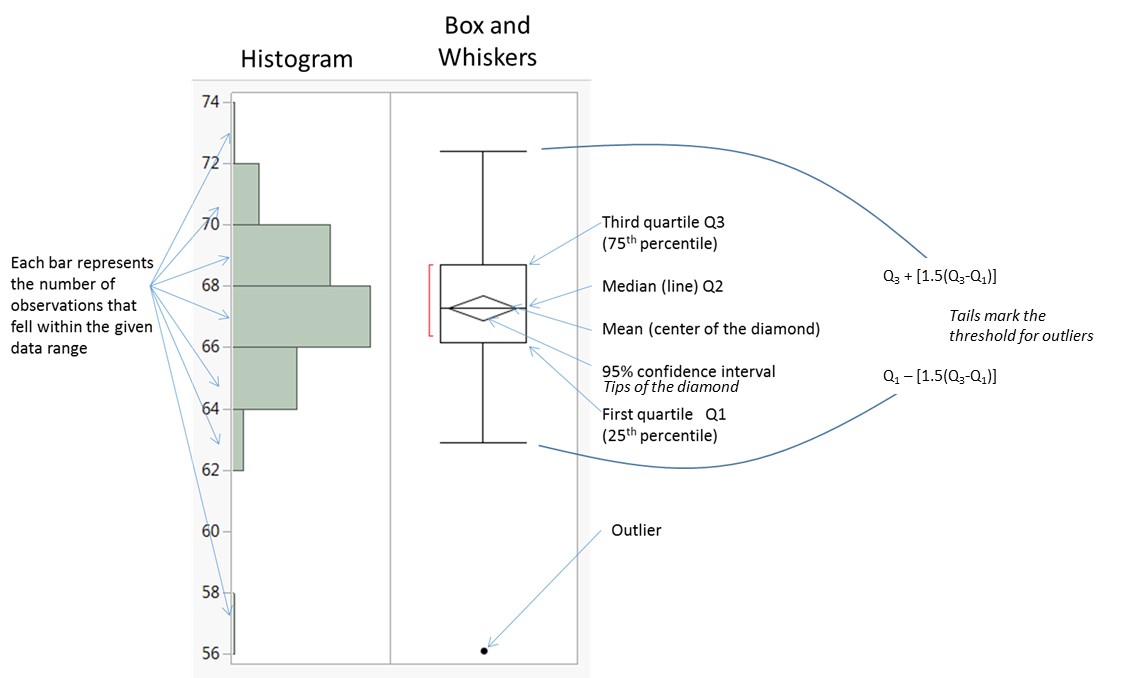
There are as many different ways to plot and graph data as there are types of plots and graphs. When doing basic data exploration, you often want to use whatever is the simplest. Typically your main goals in visualizing the data are to 1) assess the basic distribution of the data (are they normally distributed?) and look for outliers that might skew your data or bias your analysis; 2) examine the basic nature of the relationships or differences you are ultimately looking for; or 3) let your data “tell a story”.
Background Materials:
The basics of descriptive statistics from the Khan Academy. From this primary link, you can work through many additional tutorials for individual descriptive statistics metrics:
https://www.khanacademy.org/math/probability/descriptive-statistics
Elsevier journal article reviewing the basics of descriptive statistics:
http://www.sciencedirect.com/science/article/pii/S1078817410000027
Calculating and graphing statistical data:
http://www.dummies.com/how-to/education-languages/math/statistics/Calculating-Graphing-Statistical-Data.html
Common statistical graphs:
http://statistics.about.com/od/HelpandTutorials/a/7-Common-Graphs-In-Statistics.htm
http://www.statisticshowto.com/types-graphs/
Textbook References and Links:
A listing of common descriptive statistical functions in Excel:
http://www.excelfunctions.net/Excel-Statistical-Functions.html
For an introduction to the Excel Data Analysis Tool pack add in, try these:
http://www1.appstate.edu/~mcraelt/Stats II/excel1.pdf
http://www.excel-easy.com/examples/descriptive-statistics.html
http://www.dummies.com/how-to/content/how-to-use-excels-descriptive-statistics-tool.html
Downloadable data and files:
Practice Exercise: These data provide the yearly mean snow depth (from measurements taken daily) at the summit of Mount Mansfield in northern Vermont between 1954 and 2014.
Download Tools examples 1.4.csv