
Chapter 1.7: Making Predictions: Regression Analyses
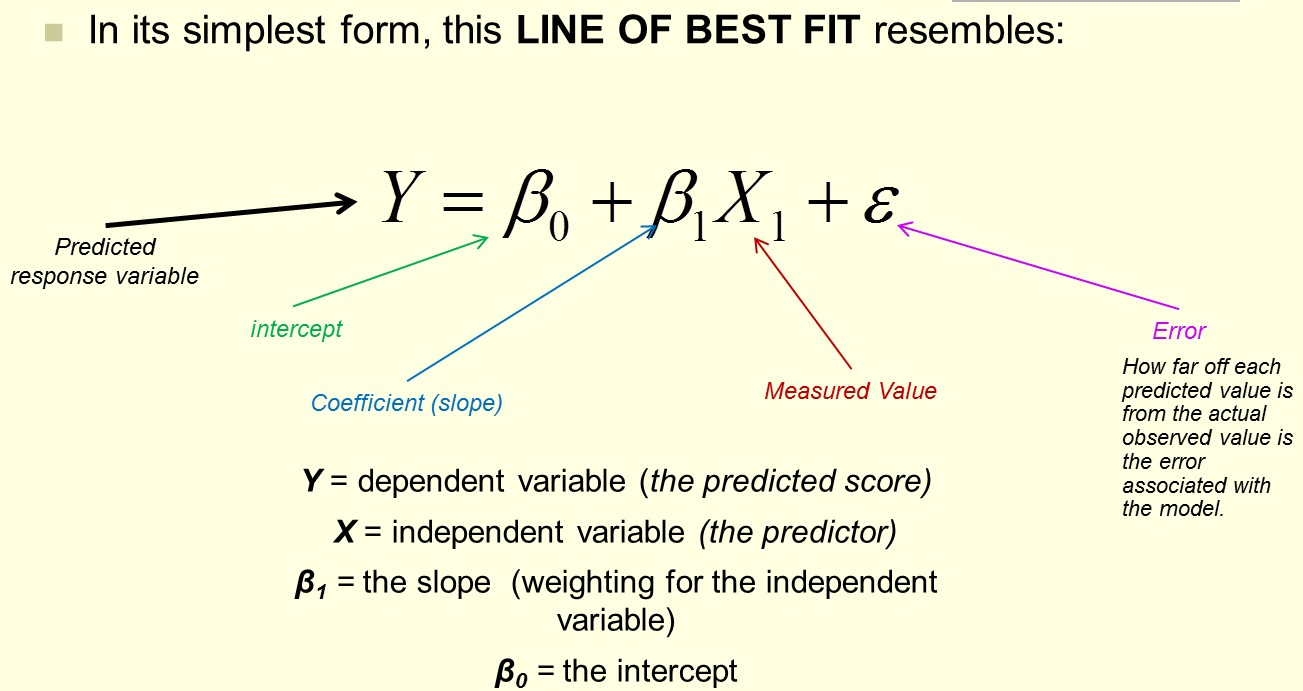
Regression analysis is a way to create a model (equation) to predict your response of interest based on a set of input predictor variables. In its most basic form (a simple linear regression with one continuous input variable used to predict one continuous response variable), this process is as easy as finding the equation for a line that best fits a scatter plot of the data. But more complex regressions, with multiple predictor variables, non-linear relationships or non-continuous variables, are also common.
Background Materials:
Regression in a nutshell from Stat Trek: http://stattrek.com/regression/linear-regression.aspx
More on regression in layman’s terms: http://www.statisticssolutions.com/what-is-linear-regression/
The basics of regression (Line of best fit) from the Khan Academy. Walk through each of the module steps to get the complete picture: https://www.khanacademy.org/math/probability/regression/regression-correlation/v/fitting-a-line-to-data
Linear regression calculator: you enter the data, and it spits out your results. This one has the added bonus of also calculating the correlation coefficient and explaining the mathematical steps. However, you will still need to determine if there is a significant relationship as the basis for your regression equation (refer back to the correlation module for more details on significance calculators):
http://www.mathportal.org/calculators/statistics-calculator/correlation-and-regression-calculator.php
Textbook References and Links: NA
Downloadable data and files:
Practice Exercise: The data in 1.7.1 were collected from an in-situ fish farm relating the age of fish to their length. The data in 1.7.2 show mean hourly fish counts through a fish ladder related to the mean number of fish retrieved by shock-and-net efforts upstream.
Download Tools examples 1.7.1.csv and Tools Example 1.7.2.csv