
Chapter 1.6: Testing for Differences Between Means: t-tests and ANOVA`s
Often, you may be interested in comparing measurements from different groups. For example, you might want to know if there is a different response for a treatment group compared to a control group that did not receive any treatment. To know if ecosystem restoration efforts are effective, you have to compare environmental metrics before and after restoration activities. To know if species respond to environmental forcings in similar ways, you have to compare their responses.
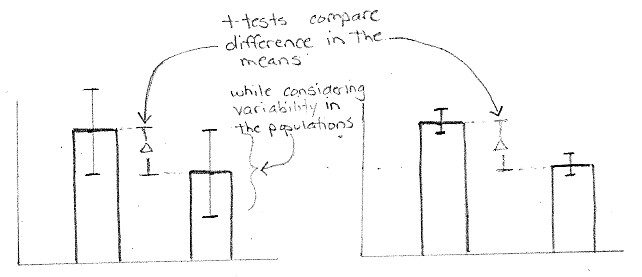
When you are comparing only two groups, you use a t-test. When you are comparing the mean response of more than two groups, you use an Analysis of Variance (ANOVA or f-test)
t-tests can get a little tricky in that there are two different tests, depending on how your observations were selected for each group: one test compares the means of two independent groups, while the other compares differences in dependent (paired) observations. This is often decided not so much by your research question but by your experimental design. It all comes down to how you selected observations for your sample groups.
ANOVA can also get a little tricky in that the inferential test only tells you if there is a significant difference somewhere among the groups you are comparing. But it does not tell you which groups are significantly different from the others. Follow up “post-hoc” tests are required for any significant ANOVA results. Perhaps the most direct post-hoc test is to conduct a set of individual independent t-tests for each possible pairing of groups, while adjusting the alpha level to avoid compounding errors. See information on the Bonferroni adjustment below for post-hoc student’s t-tests.
Background Materials:
Student’s t-tests from the Handbook of Biological Statistics: http://www.biostathandbook.com/twosamplettest.html
Independent test basics: http://www.ruf.rice.edu/~bioslabs/tools/stats/ttest.html
Dependent (matched pairs) basics: http://www.ruf.rice.edu/~bioslabs/tools/stats/pairedttest.html
or http://www.statisticssolutions.com/manova-analysis-paired-sample-t-test/
ANOVA from the Handbook of Biological Statistics:
http://www.statisticssolutions.com/manova-analysis-anova/ or try http://www.biostathandbook.com/onewayanova.html
A breakdown of the ANOVA procedure along with how to fill out an ANOVA table: http://sphweb.bumc.bu.edu/otlt/MPH-Modules/BS/BS704_HypothesisTesting-ANOVA/BS704_HypothesisTesting-Anova_print.html
Bonferroni Adjustment: The biostats handbook on the problems with multiple comparisons and how to adjust your significance threshold (alpha level) when conducting post-hoc multiple means comparisons: http://www.biostathandbook.com/multiplecomparisons.html
and a simple calculator to conduct a Bonferroni adjustment: http://www.quantitativeskills.com/sisa/calculations/bonfer.htm
Textbook References and Links:
A quick t-test calculator with options to enter data or key descriptive metrics: http://www.graphpad.com/quickcalcs/ttest1/?Format=SD
t-test critical value look-up tables. Interested in doing it the old fashioned way? Just look up your set alpha (significance level in the correct column), and your correct degrees of freedom (to identify the correct row) and see if the t-test statistic you have calculated exceeds the critical value in the main body of the table:
https://www.easycalculation.com/statistics/t-distribution-critical-value-table.php
or this one with links to calculators as well: http://www.statstodo.com/TTest_Tab.php
ANOVA calculator: you enter the basic descriptive statistics, and this calculator runs the ANOVA for you….but don’t forget your post hoc tests if you find a significant result:
http://www.danielsoper.com/statcalc/calculator.aspx?id=43
This one just lets you paste in your observation data for each of up to 5 groups: http://www.socscistatistics.com/tests/anova/Default2.aspx
ANOVA (F-test) critical value look-up tables. Interested in doing it the old fashioned way? Just identify the correct degrees of freedom for the between term (to identify the correct column) and the degrees of freedom within (to identify the correct row) and see if the F- test statistic you have calculated exceeds the critical value in the main body of the table:
https://sites.google.com/site/infinitystat/advanced-topics/analysis-of-variance
Downloadable data and files:
Practice Exercise: These data include biological metrics (weight) taken on banded birds from three different species that were collected before and after their seasonal migration.
Download Tools examples 1.6.csv