
Chapter 1.8: Chi-square (ᵡ2) Test
Sometimes (most commonly in wildlife or vegetation inventories) the response measured is actually a count of how many observations are taken grouped into distinct categories. A Chi-square test is a non-parametric tool that can be used to see if counts of observations differ from how they are expected to occur across several classes. Because the Chi-square test is technically a non-parametric test, there are no assumptions for normality, but your observations must still be independent and randomly sampled to provide an unbiased estimate of the population.
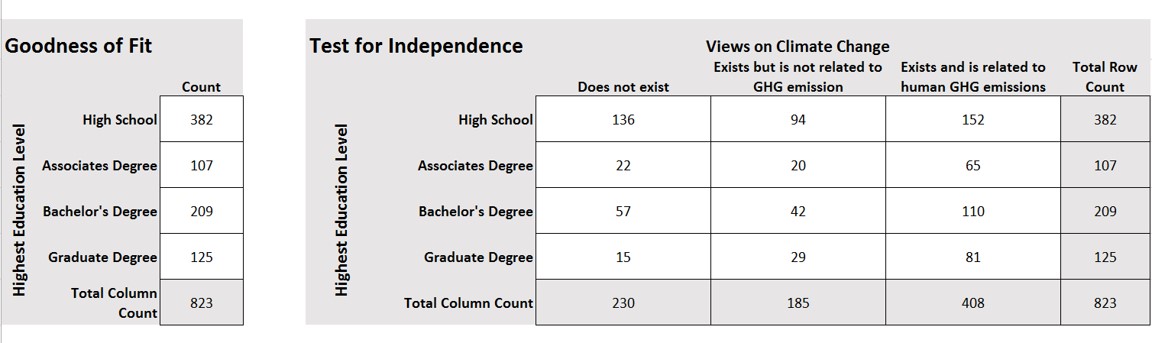
When you are examining only the counts of observations that fall into the different categories of ONE categorical variable, use the Chi-square goodness of fit.
When you are examining the counts of observations that fall into the different categories across several categorical variables, use the Chi-square test for independence. This allows you to determine if the category into which an observation falls in one of those variables influences the category for the other variables. In other words, you are testing to see if these two categorical variables are associated with one another.
Background Materials:
Khan Academy’s take on the Chi-square distribution and tests: https://www.khanacademy.org/math/probability/statistics-inferential/chi-square/v/chi-square-distribution-introduction
The Chi-square Goodness of Fit test (one variable with several categories to test for differences in the frequency of observations from what was expected): http://stattrek.com/chi-square-test/goodness-of-fit.aspx?Tutorial=AP
The Chi-square test for Independence (two or more variables to test for association): http://stattrek.com/chi-square-test/independence.aspx?Tutorial=AP
Textbook References and Links:
Chi Square probability calculators:
Goodness of Fit (you enter the observed counts to test observed vs. expected frequencies for one variable): http://graphpad.com/quickcalcs/chisquared1.cfm
Or try just entering the Chi-square critical value that you calculate on your own to determine the probability associated with your test: http://stattrek.com/online-calculator/chi-square.aspx
Test for Independence (you enter the counts for up to 5 variables and 5 categories within each variable to run this analysis): http://www.socscistatistics.com/tests/chisquare2/Default2.aspx
Chi-square distribution look up tables. Interested in doing it the old fashioned way? Just look up your set alpha (significance level in the correct column) and your correct degrees of freedom (to identify the correct row) and see if the Chi-square test statistic you have calculated exceeds the critical value in the main body of the table: http://sites.stat.psu.edu/~mga/401/tables/Chi-square-table.pdf
Downloadable data and files: NA